Quantum-Dot Antibody Conjugation
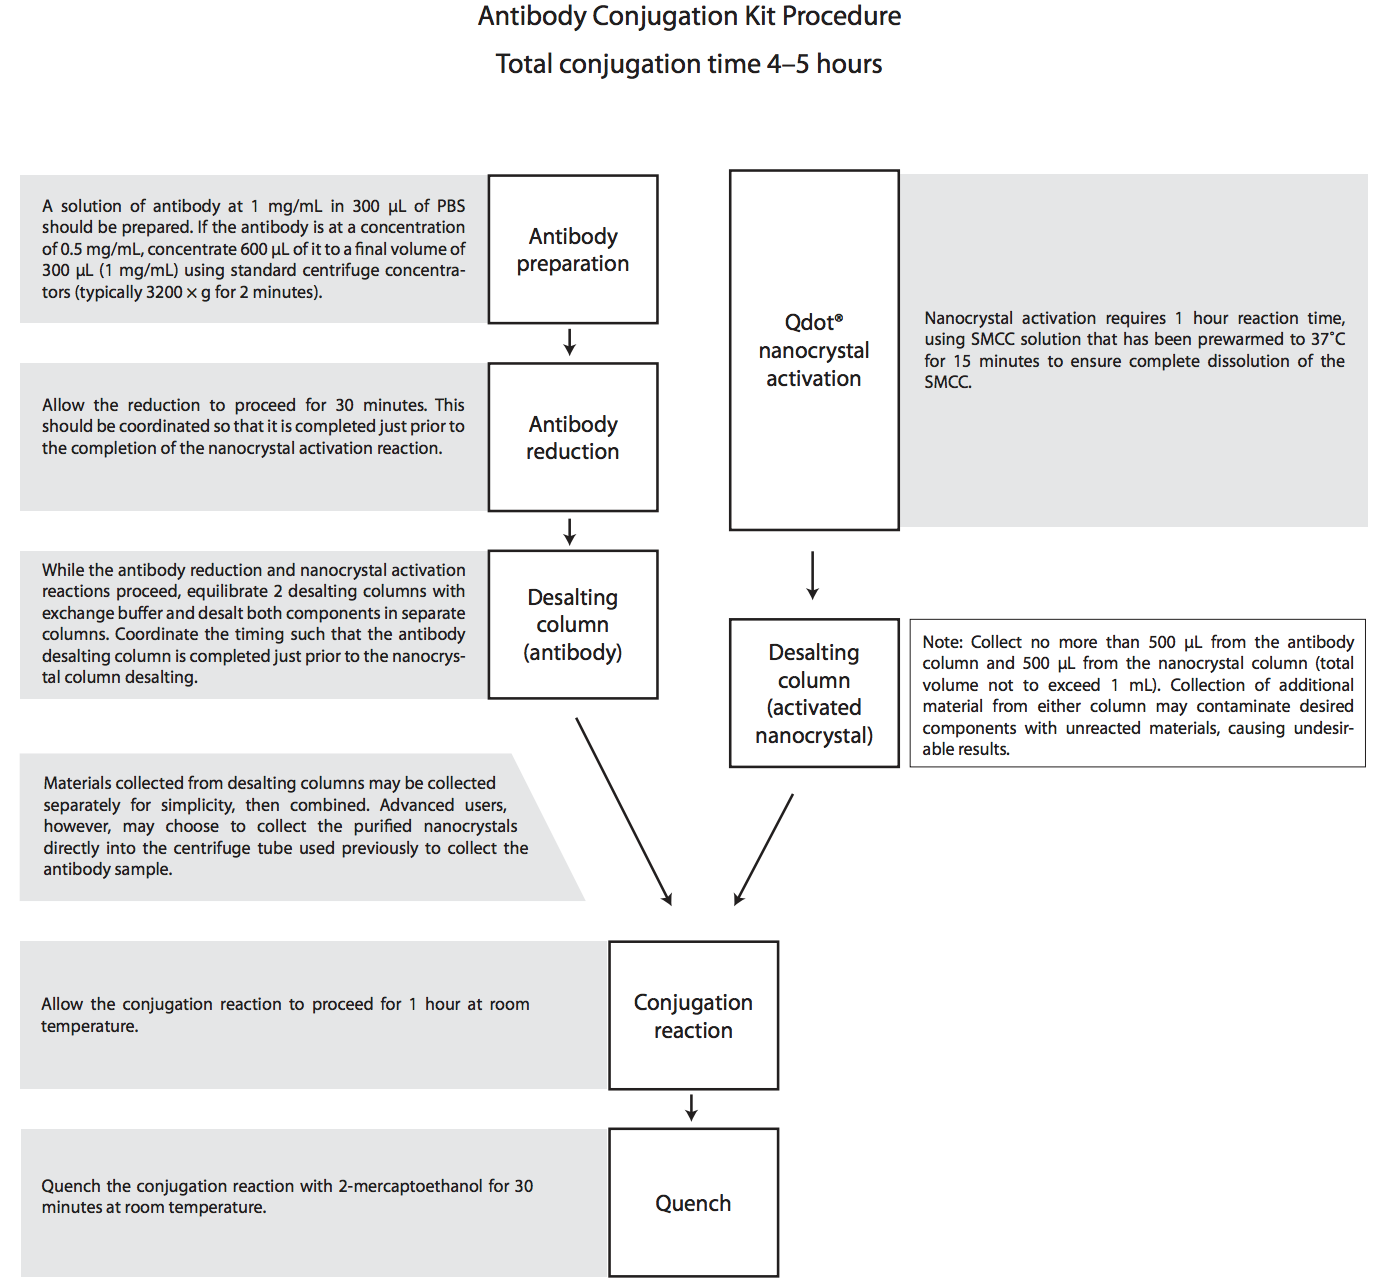
This is a 4-5 hr protocol to conjugate antibodies to fluorescent quantum dots (QDs). The protocol follows the Life Tech product manual, except for the last step where we switch to an FPLC-based QDot purification. This doesn’t add much time and significantly improves separation between QDot and un-reacted antibody.
Contents
Section titled “Contents”1. Materials
Section titled “1. Materials”1.1 Quantum dots
Section titled “1.1 Quantum dots”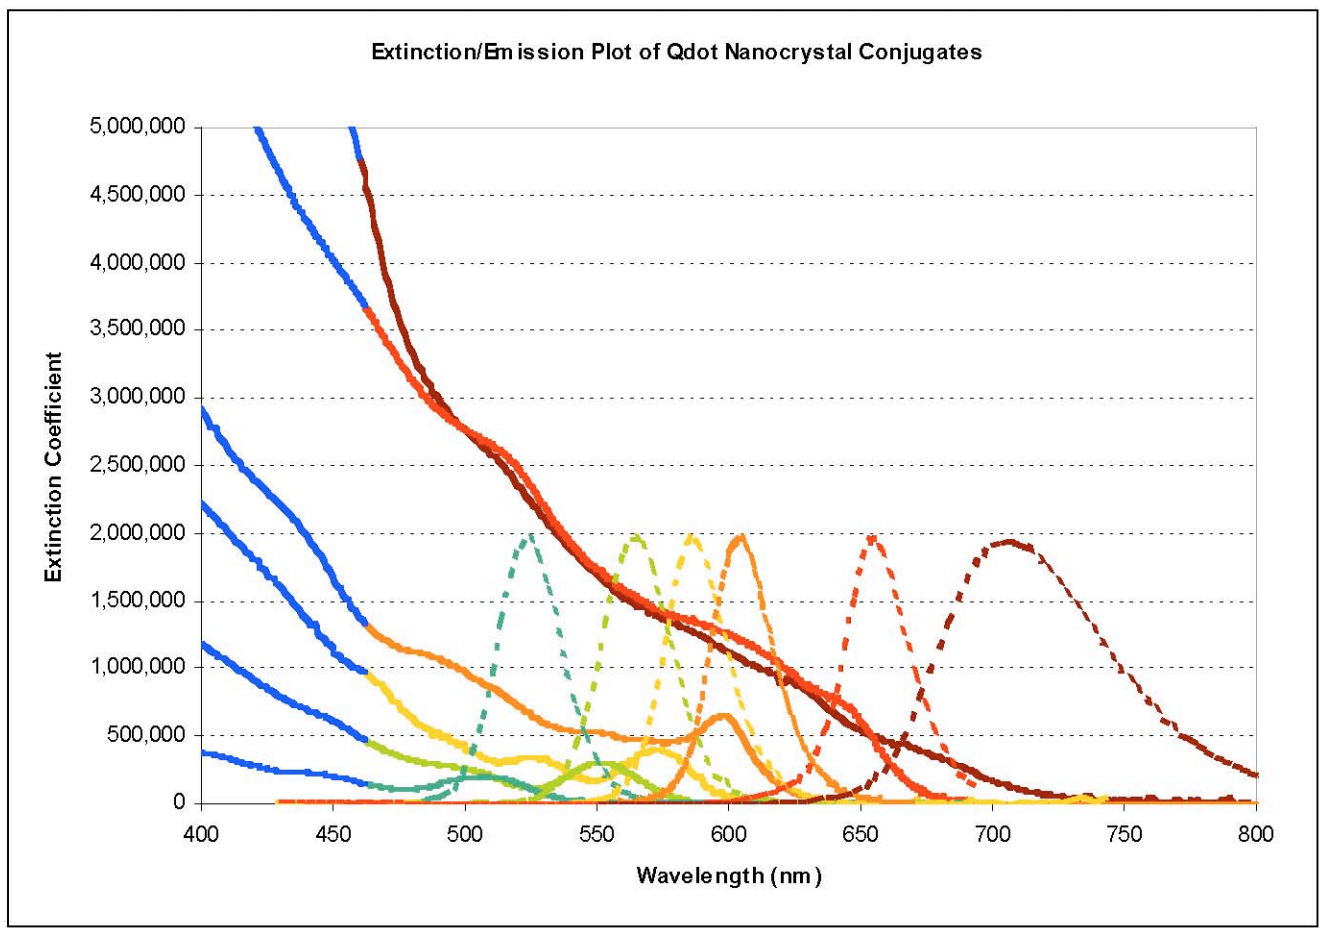
We buy the QD-antibody conjugation kit from Life Technologies. Typically, we buy the following reagents:
Quantum Dots:
1.2 Antibodies
Section titled “1.2 Antibodies”- anti-FLAG Monoclonal M2 (Sigma cat #F3165-1MG PDF) – best antibody for recognizing C- or N-terminal FLAG epitope tags. This antibody is superior to the M1-monoclonal antibody ad does not require Ca+2 for recognizing the FLAG-epitope.
- anti-DIG Fab fragment from Sheep (Roche cat #11214667001 (dead link))
- Anti-HA from mouse (Thermo cat # #26183 (dead link))
2. Procedure
Section titled “2. Procedure”Before you begin, read the following two manuals carefully:
- Quantum dot (QD)–antibody conjugates are prepared according to the manufacturer-provided protocol with a minor modification in the final gel-filtration step.
- After the conjugation reaction is quenched with 2-mercaptoethanol (manufacturer protocol), the QD–antibody mixture is passed through a Sepharose S300 FPLC column. The QDs come out in the void volume while the antibodies and other reaction components enter the Sepharose matrix.
- QD conjugates are concentrated with MW 50 kDa microcentrifuge concentrators and stored for up to 3 months at 4˚C in PBS at a final concentration of 100–500 nM.
3. Determining concentration
Section titled “3. Determining concentration”Depending on the amount of antibody that you conjugated, you may are may not be able to get an accurate reading using the nanodrop for your non-diluted conjugated sample. Because of this, I made a standard curve using the 705 anti-biotin commercial Q-dots. The standard curve and the data for 705 Qdots is given here 705. The standard curve and the data for 605 Qdots is given here 605.
To use the standard curve, make a serial dilution of your conjugated Qdots. The measurements are made using the UV-Vis mode on the nanodrop. Before blanking, turn keep the baseline auto correct on and keep the auto-path length off. Do not change the settings mid-run or your curves will get weird. Always blank and dilute in the same buffer. For this case use 1X PBS. Depending on what type of quantum dots you are quantifying, the absorbance should be different. For Qdot 705 the wavelength is 350 and for Qdot 605 the wavelength is 270.
Your individual dilutions should be fairly close in their projected value after correcting for concentration, if not repeat your experiment. If so, then average your values and this is the concentration of your conjugated Qdots.